Travel time analysis with Apple Shortcut
Motivation
Travel during public holidays in China is a headache-inducing activity, especially during national day holidays, one of the longest public holidays. People tend to pour out to visit their family/friends or travel to long-expecting tour sites. Traffic could be overwhelmingly heavy during this period.
To deal with this situation, some schedule their travel time carefully. Long before the off-duty time of 31 Sep, the day before the holiday begins, people check their map apps anxiously again and again to get a glimpse of the development of traffic jams. Experiences of the best time for departure spread on social media, though they tend to convey conflicting speculations. I got on the road at 7:30 on 1 Oct, hoping an earlier departure could make my journey easier, yet I got stuck on the road for around 10 hours, which was around 3x the ordinary travel time.
P.S. I later realized that I almost chose the worst time to go...
P.S. I also guessed that the return route in the middle of the holidays would be smoother, yet it turned out that my intuition was the complete opposite of reality.
This experience made me think about the possibility of logging the travel time automatically so that I can have a better understanding of the pattern and help me select the best time to depart next time. This sounds cool, but there is a fundamental gap:
Nowadays, the most developed map apps run on smartphones. Providing APIs for automating/scripting things is not a common practice of these apps.
Apple Shortcut for automatic travel time logging
Luckily, Apple Shortcut gives me a way out. For the inbuilt apps on iPhone/iPad/MacBook, like Apple Maps, Apple Calendar, Apple Notes, etc., it provides various actions for accessing the core functionalities of these apps. With Apple Shortcut, you can chain these actions, set up conditions, and create a workflow that automates the process of different tasks.
Apple shortcut reintroduce scripting to the mobile world. Any geek with an Apple device can't resist the temptation of playing with it.
Alright, let's get started with the travel time logging workflow.
Step 1: Setup an Apple Shortcut for travel time logging
You can get the shortcut I created from here. The shortcut consists of 2 major parts:
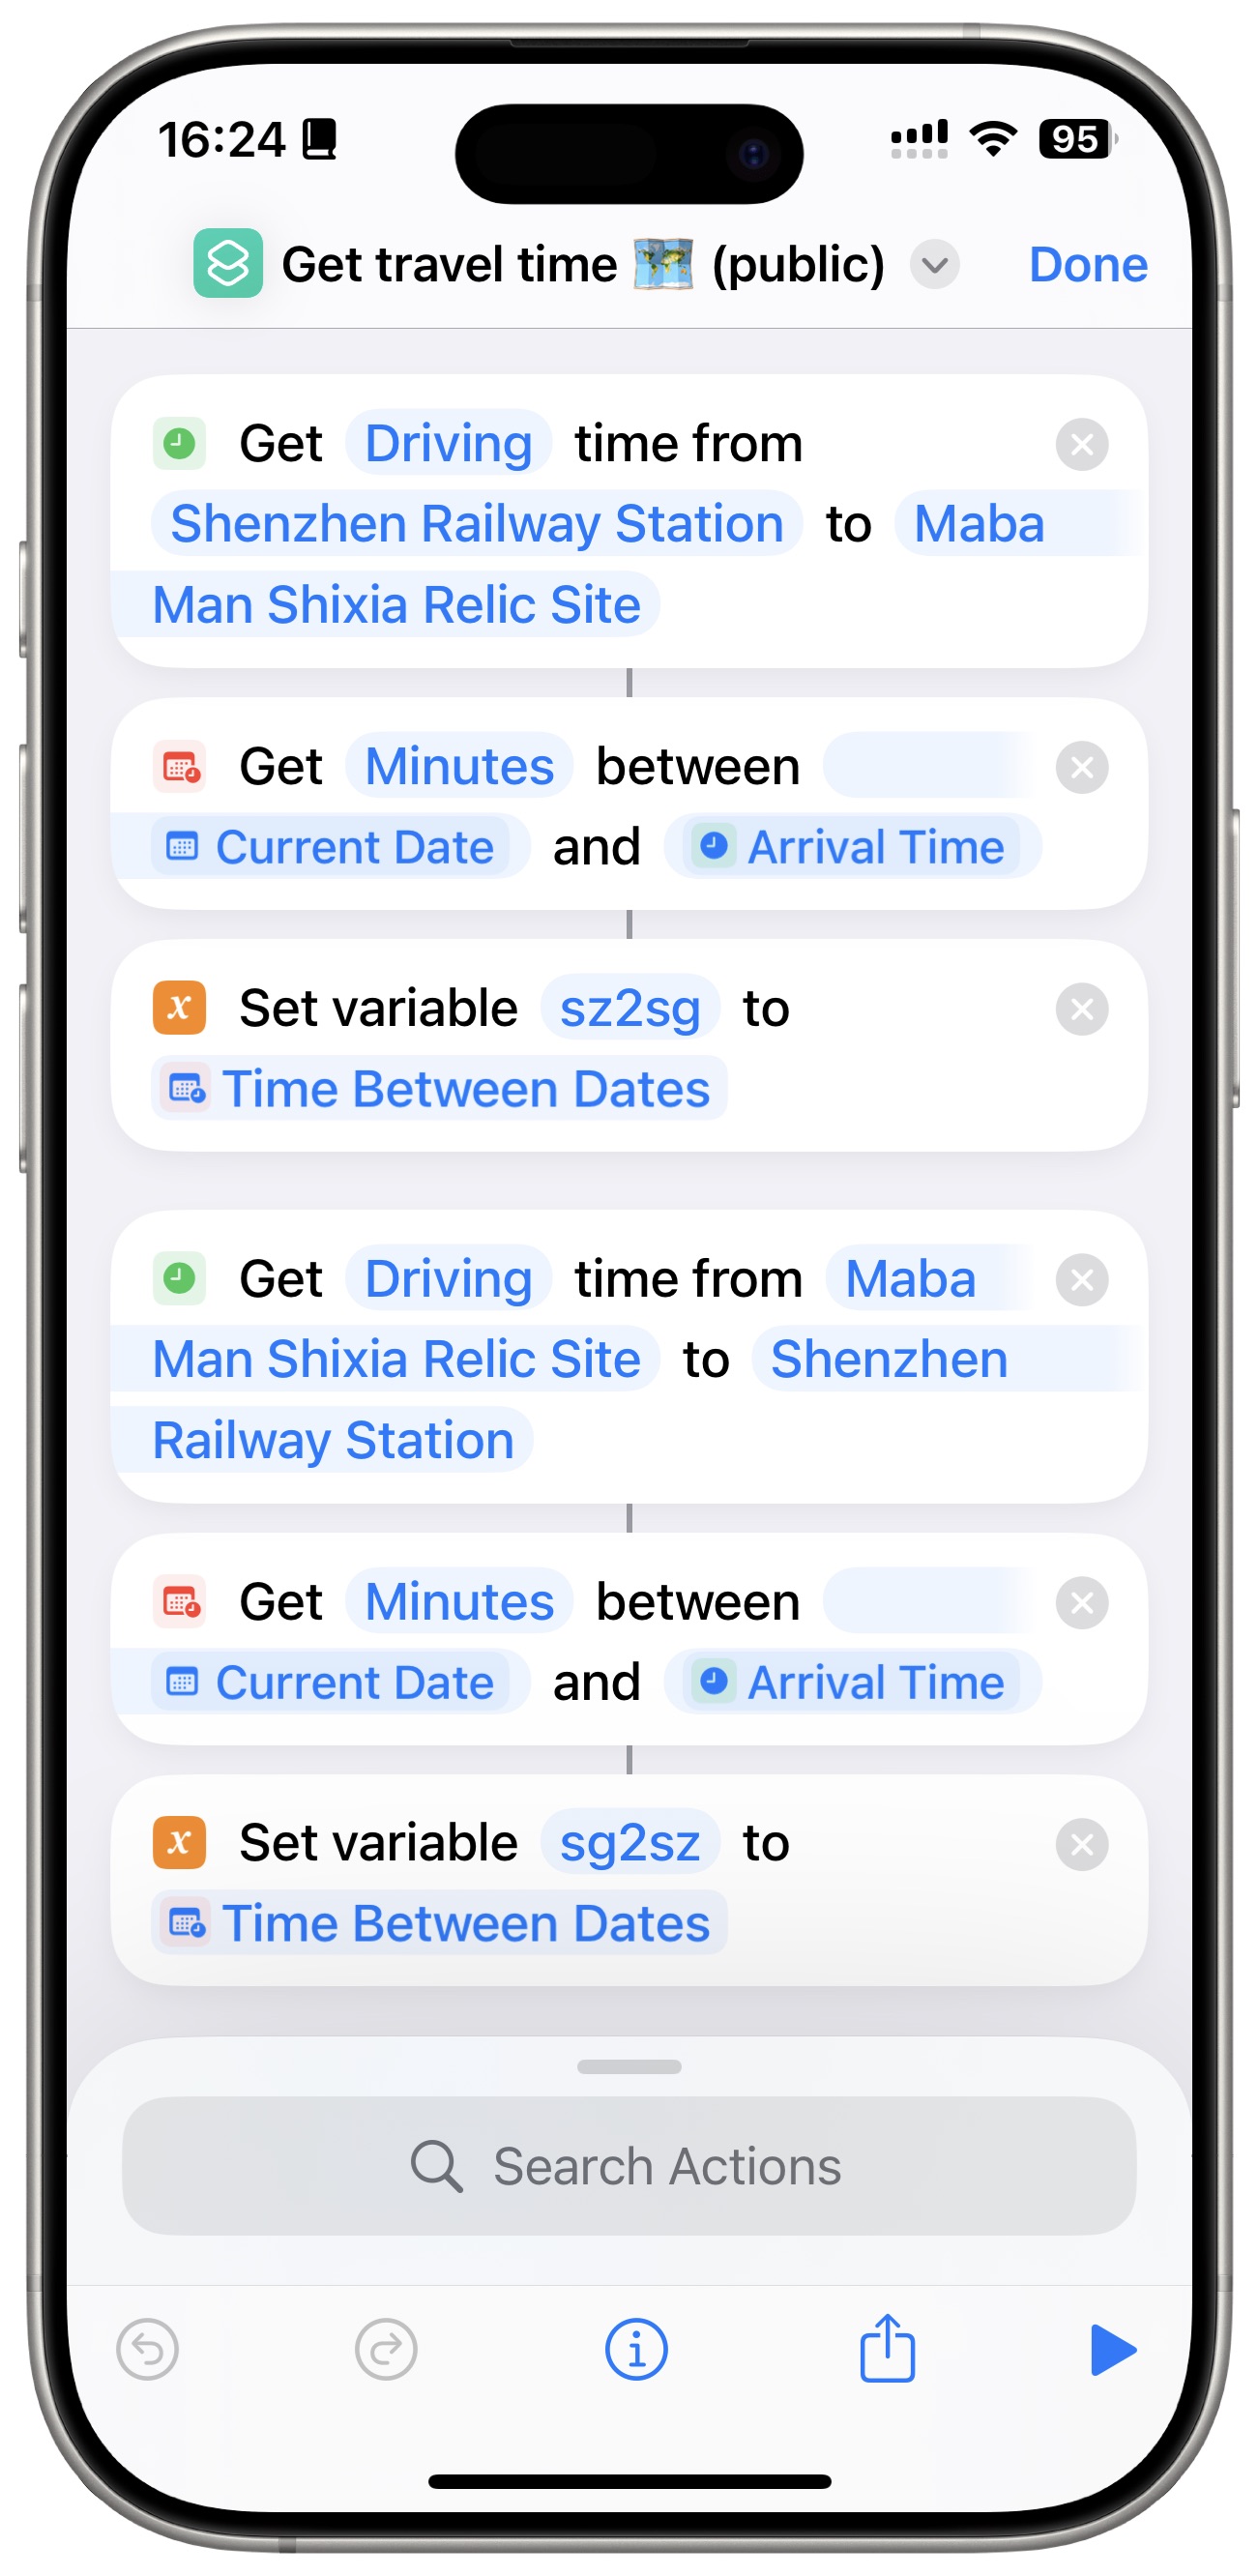
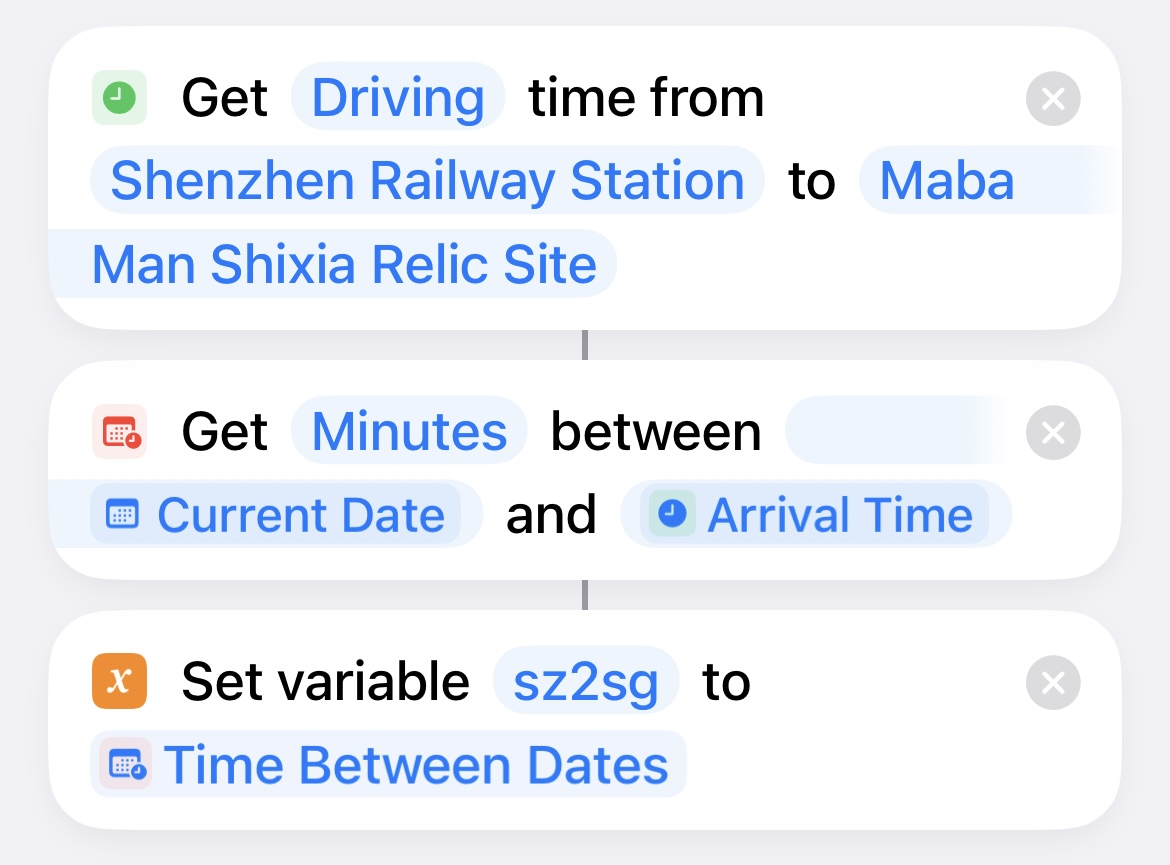
- Travel time calculation
The actions look like this:
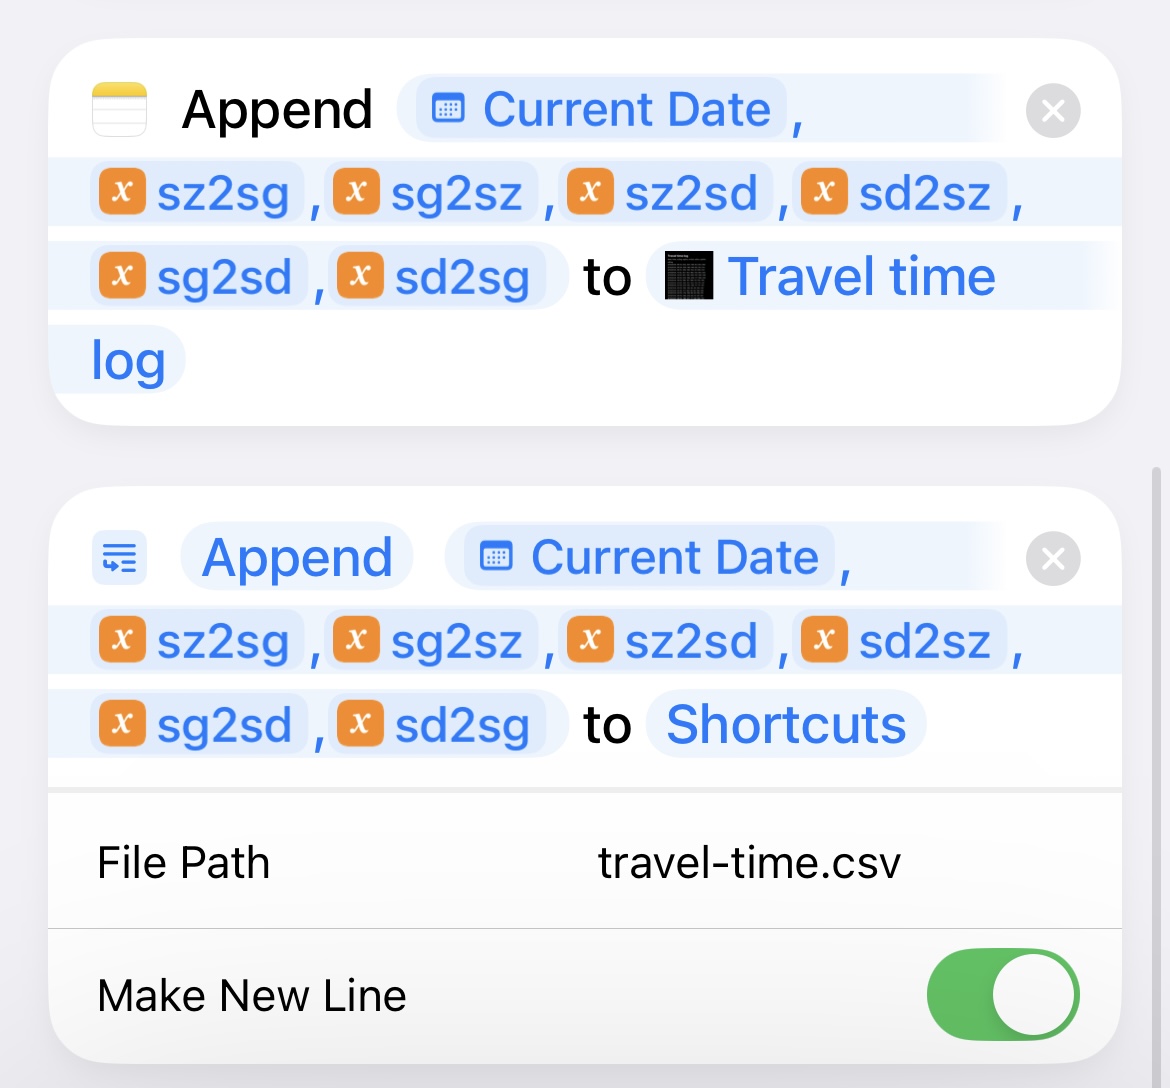
- Saving travel time to file
I write the collected travel time between different cities to a Apple Notes note as well as a .csv file:
Step 2: Trigger the shortcut automatically
On iPhone, a shortcut can be automatically triggered by:
- Time of the day
- Location
- NFC tag
- ...
For me, triggering the shortcut by time is enough: from 0:00 to 24:00, every 2 hours, the shortcut will be triggered to calculate the travel time between two cities.
Step 3: Analyze the travel time data
Now I got the .csv file:
date,time,sz2sg,sg2sz,sz2sd,sd2sz,sg2sd,sd2sg
...
2/10/2024,10:00,307,195,233,160,119,317
2/10/2024,13:20,257,193,196,135,184,230
2/10/2024,14:00,261,195,208,154,194,238
2/10/2024,16:00,234,196,249,177,196,229
2/10/2024,18:00,196,197,199,131,191,190
...
Analyzing them with Python is straightforward. The code: analysis.ipynb
Traffic pattern analysis
Sadly, I only came up with this idea on 1 Oct and had it set up on 2 Oct so that data on 1 Oct was not collected. The analysis followed is based on my impression and the data collected from 2 Oct to 9 Oct.
During my holiday, I traveled between Shenzhen (SZ), Shanguan (SG), and Shunde (SD). These Guangdong cities were selected as the representative destinations for the analysis. The patterns they revealed may not conform to the general situation of the whole country, but they can still provide some insights.
Traffic pressure during the holiday
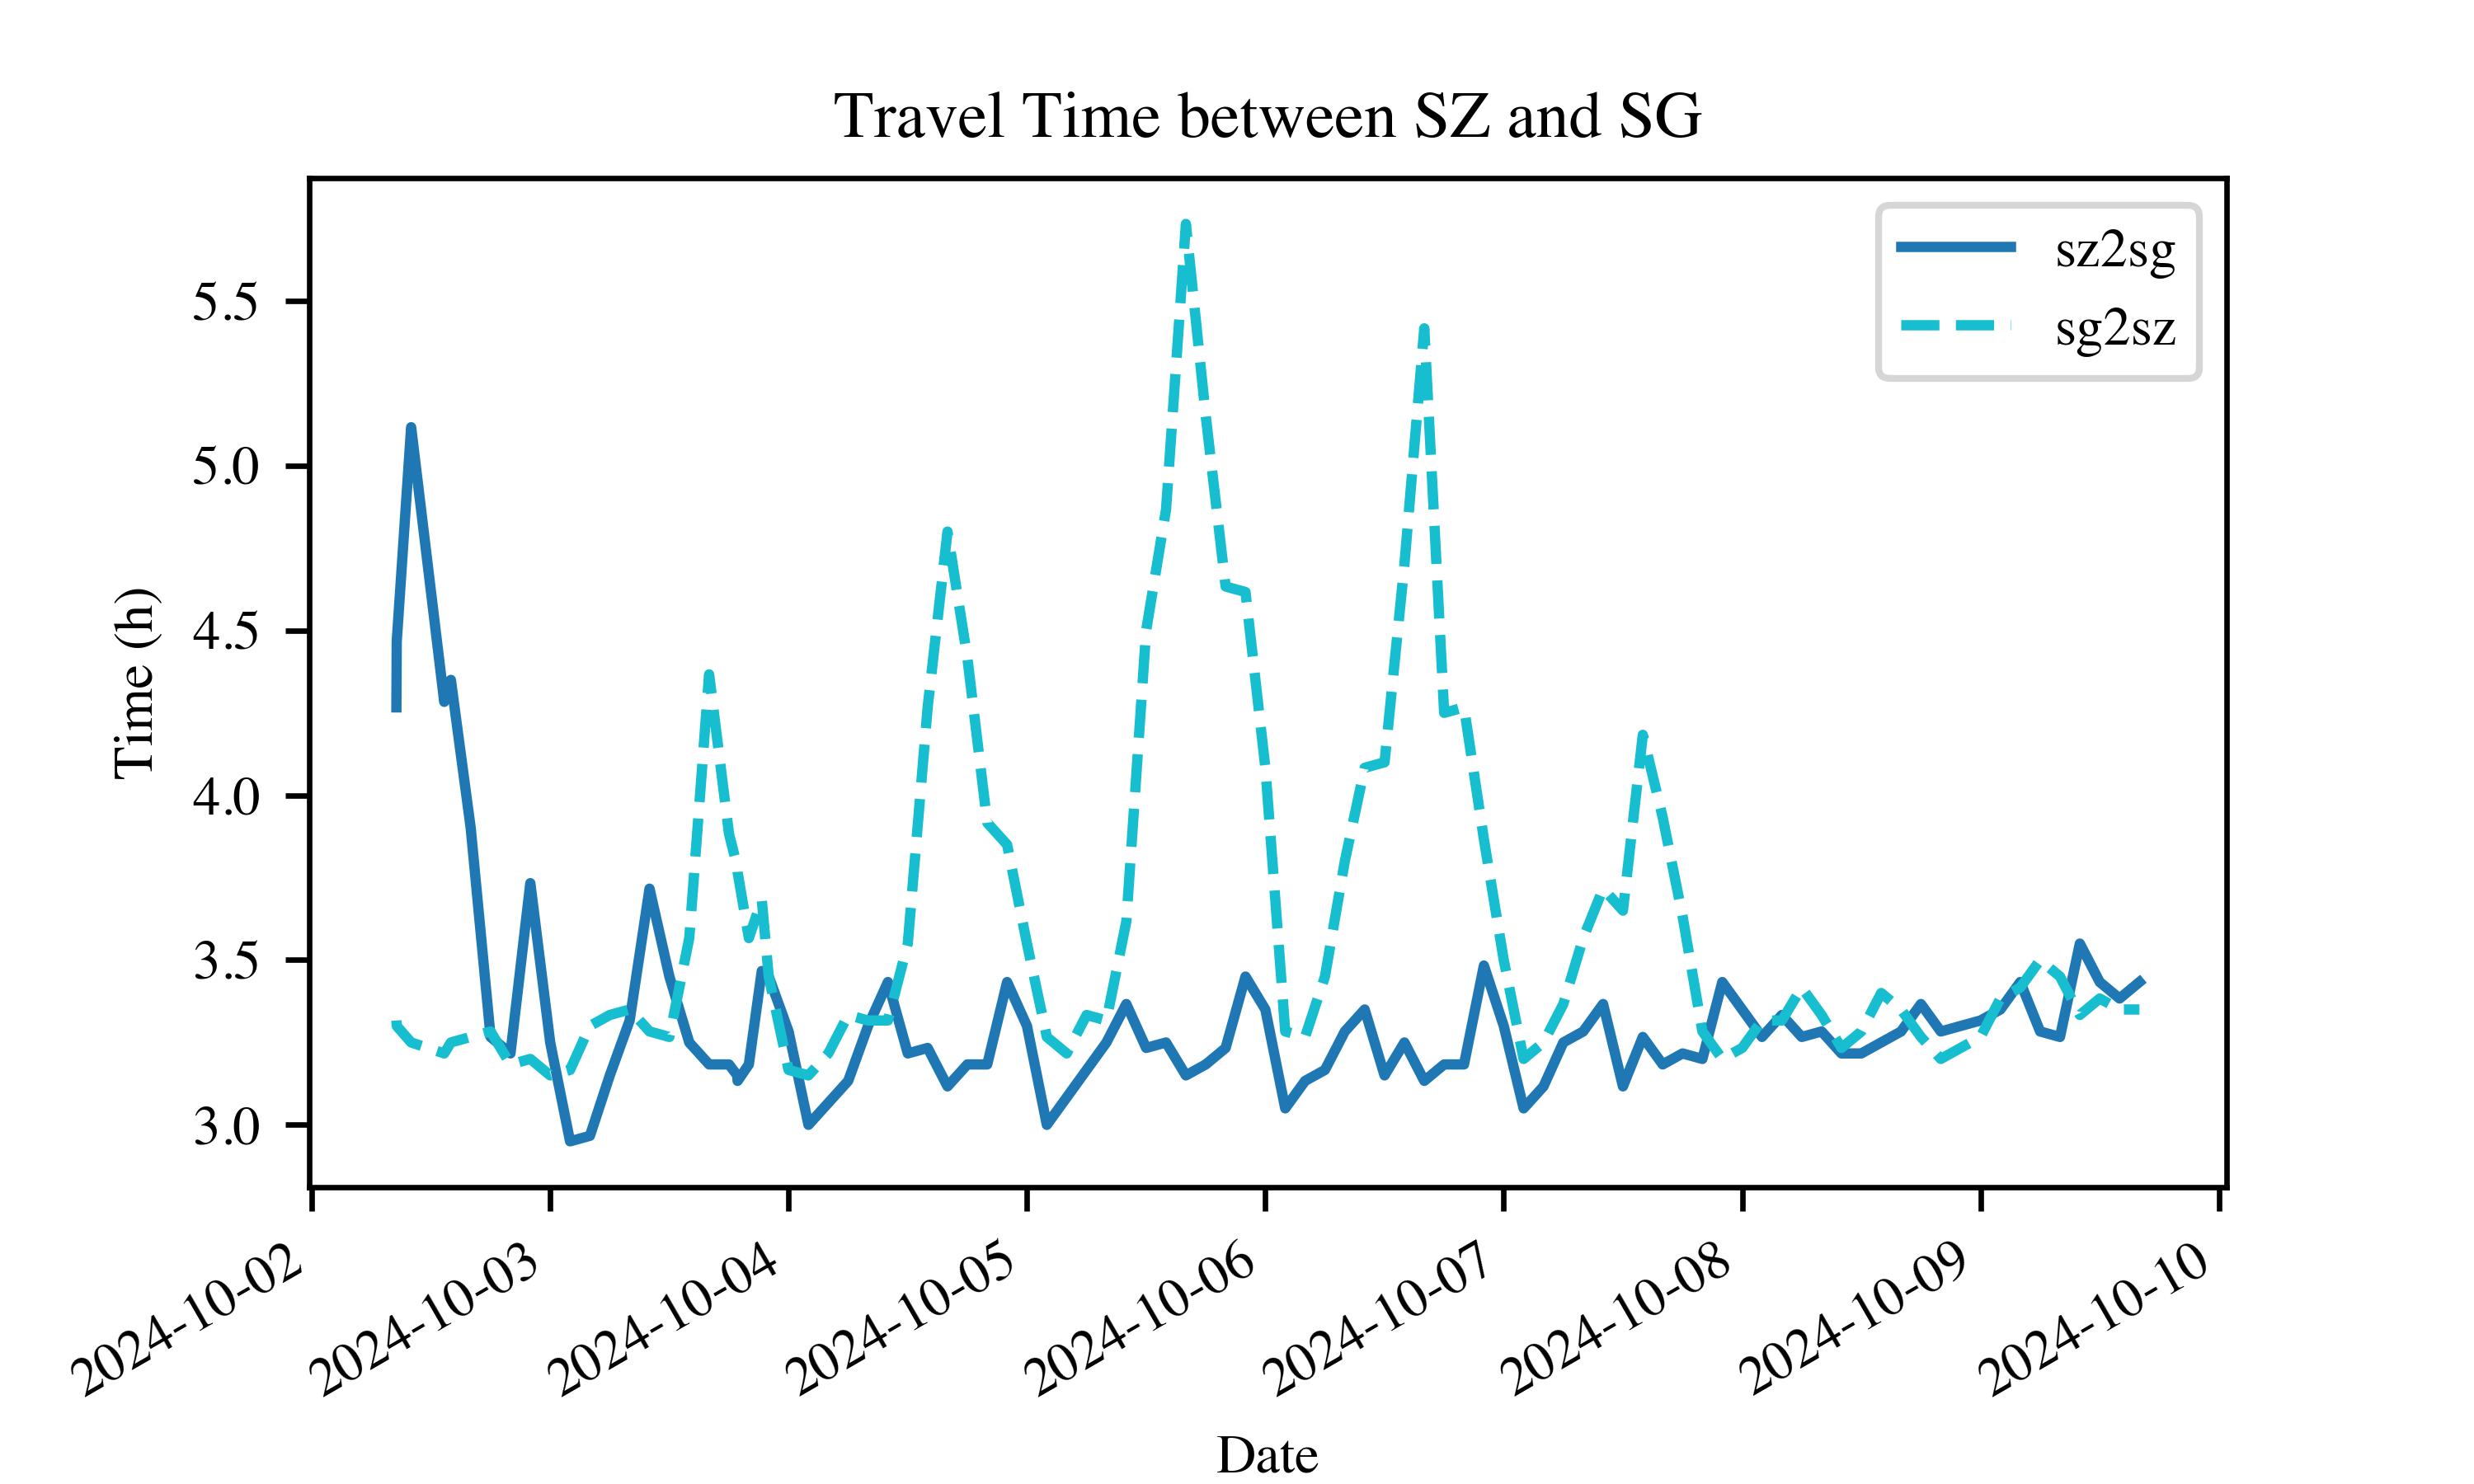
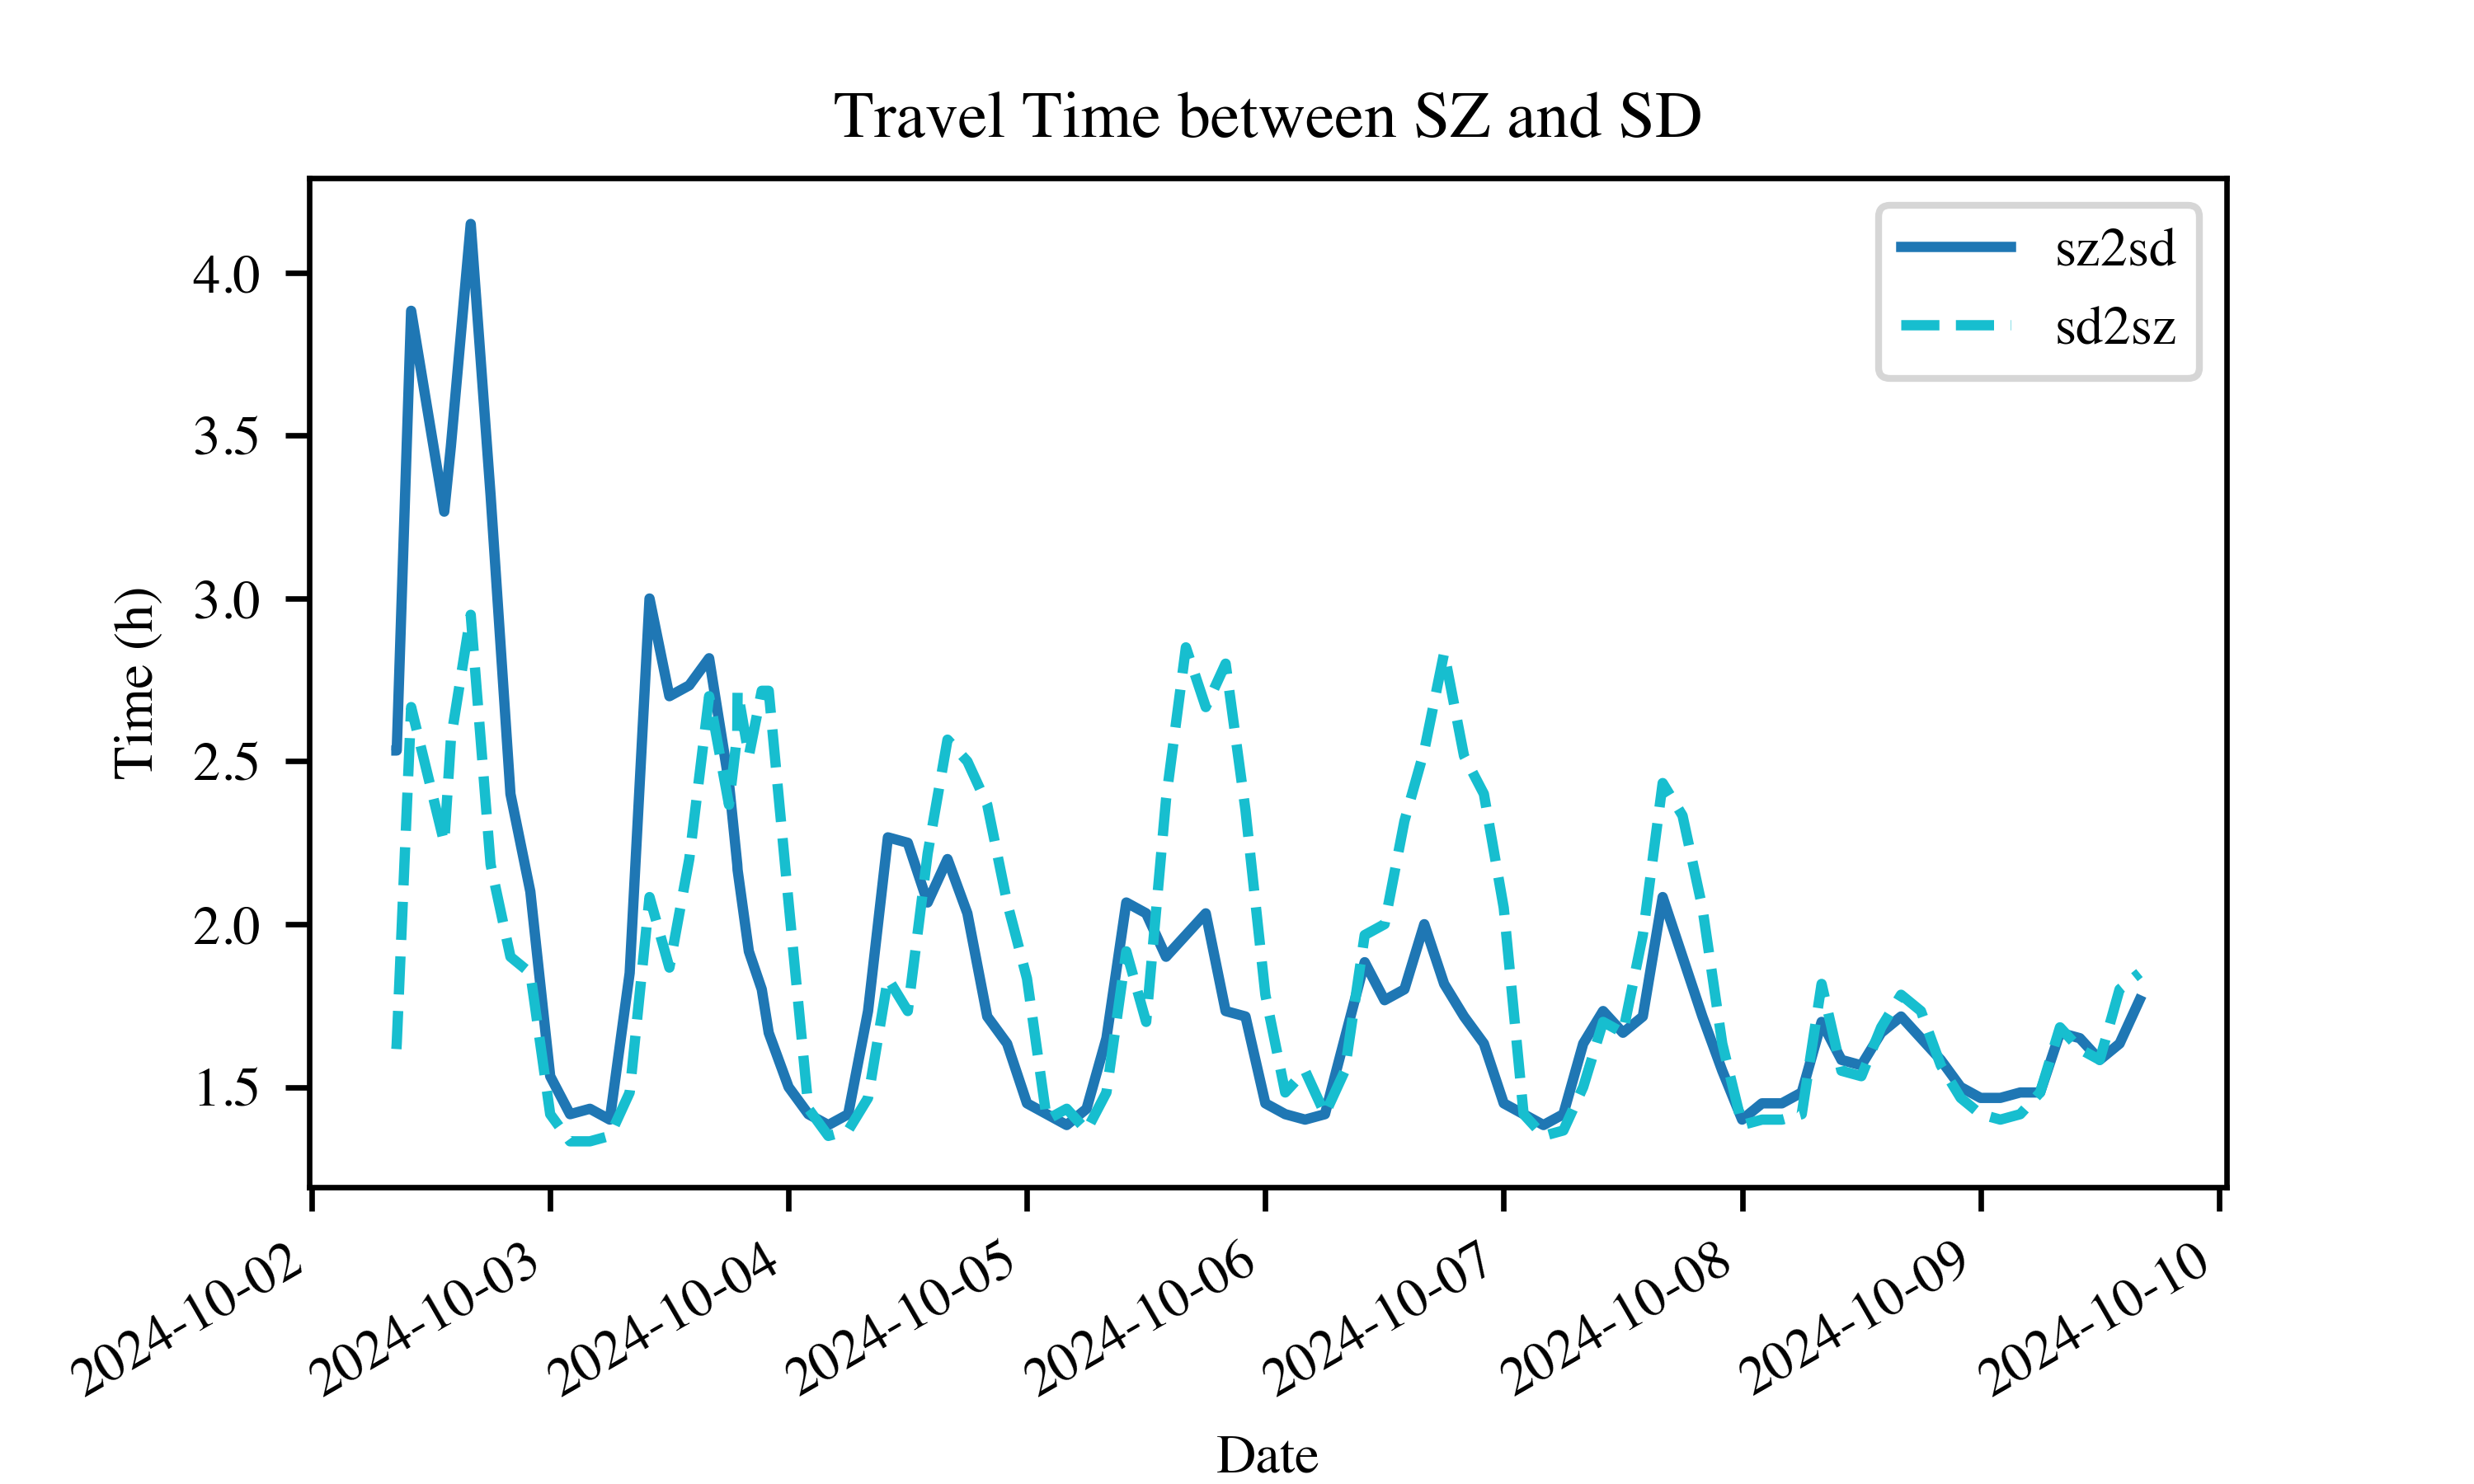
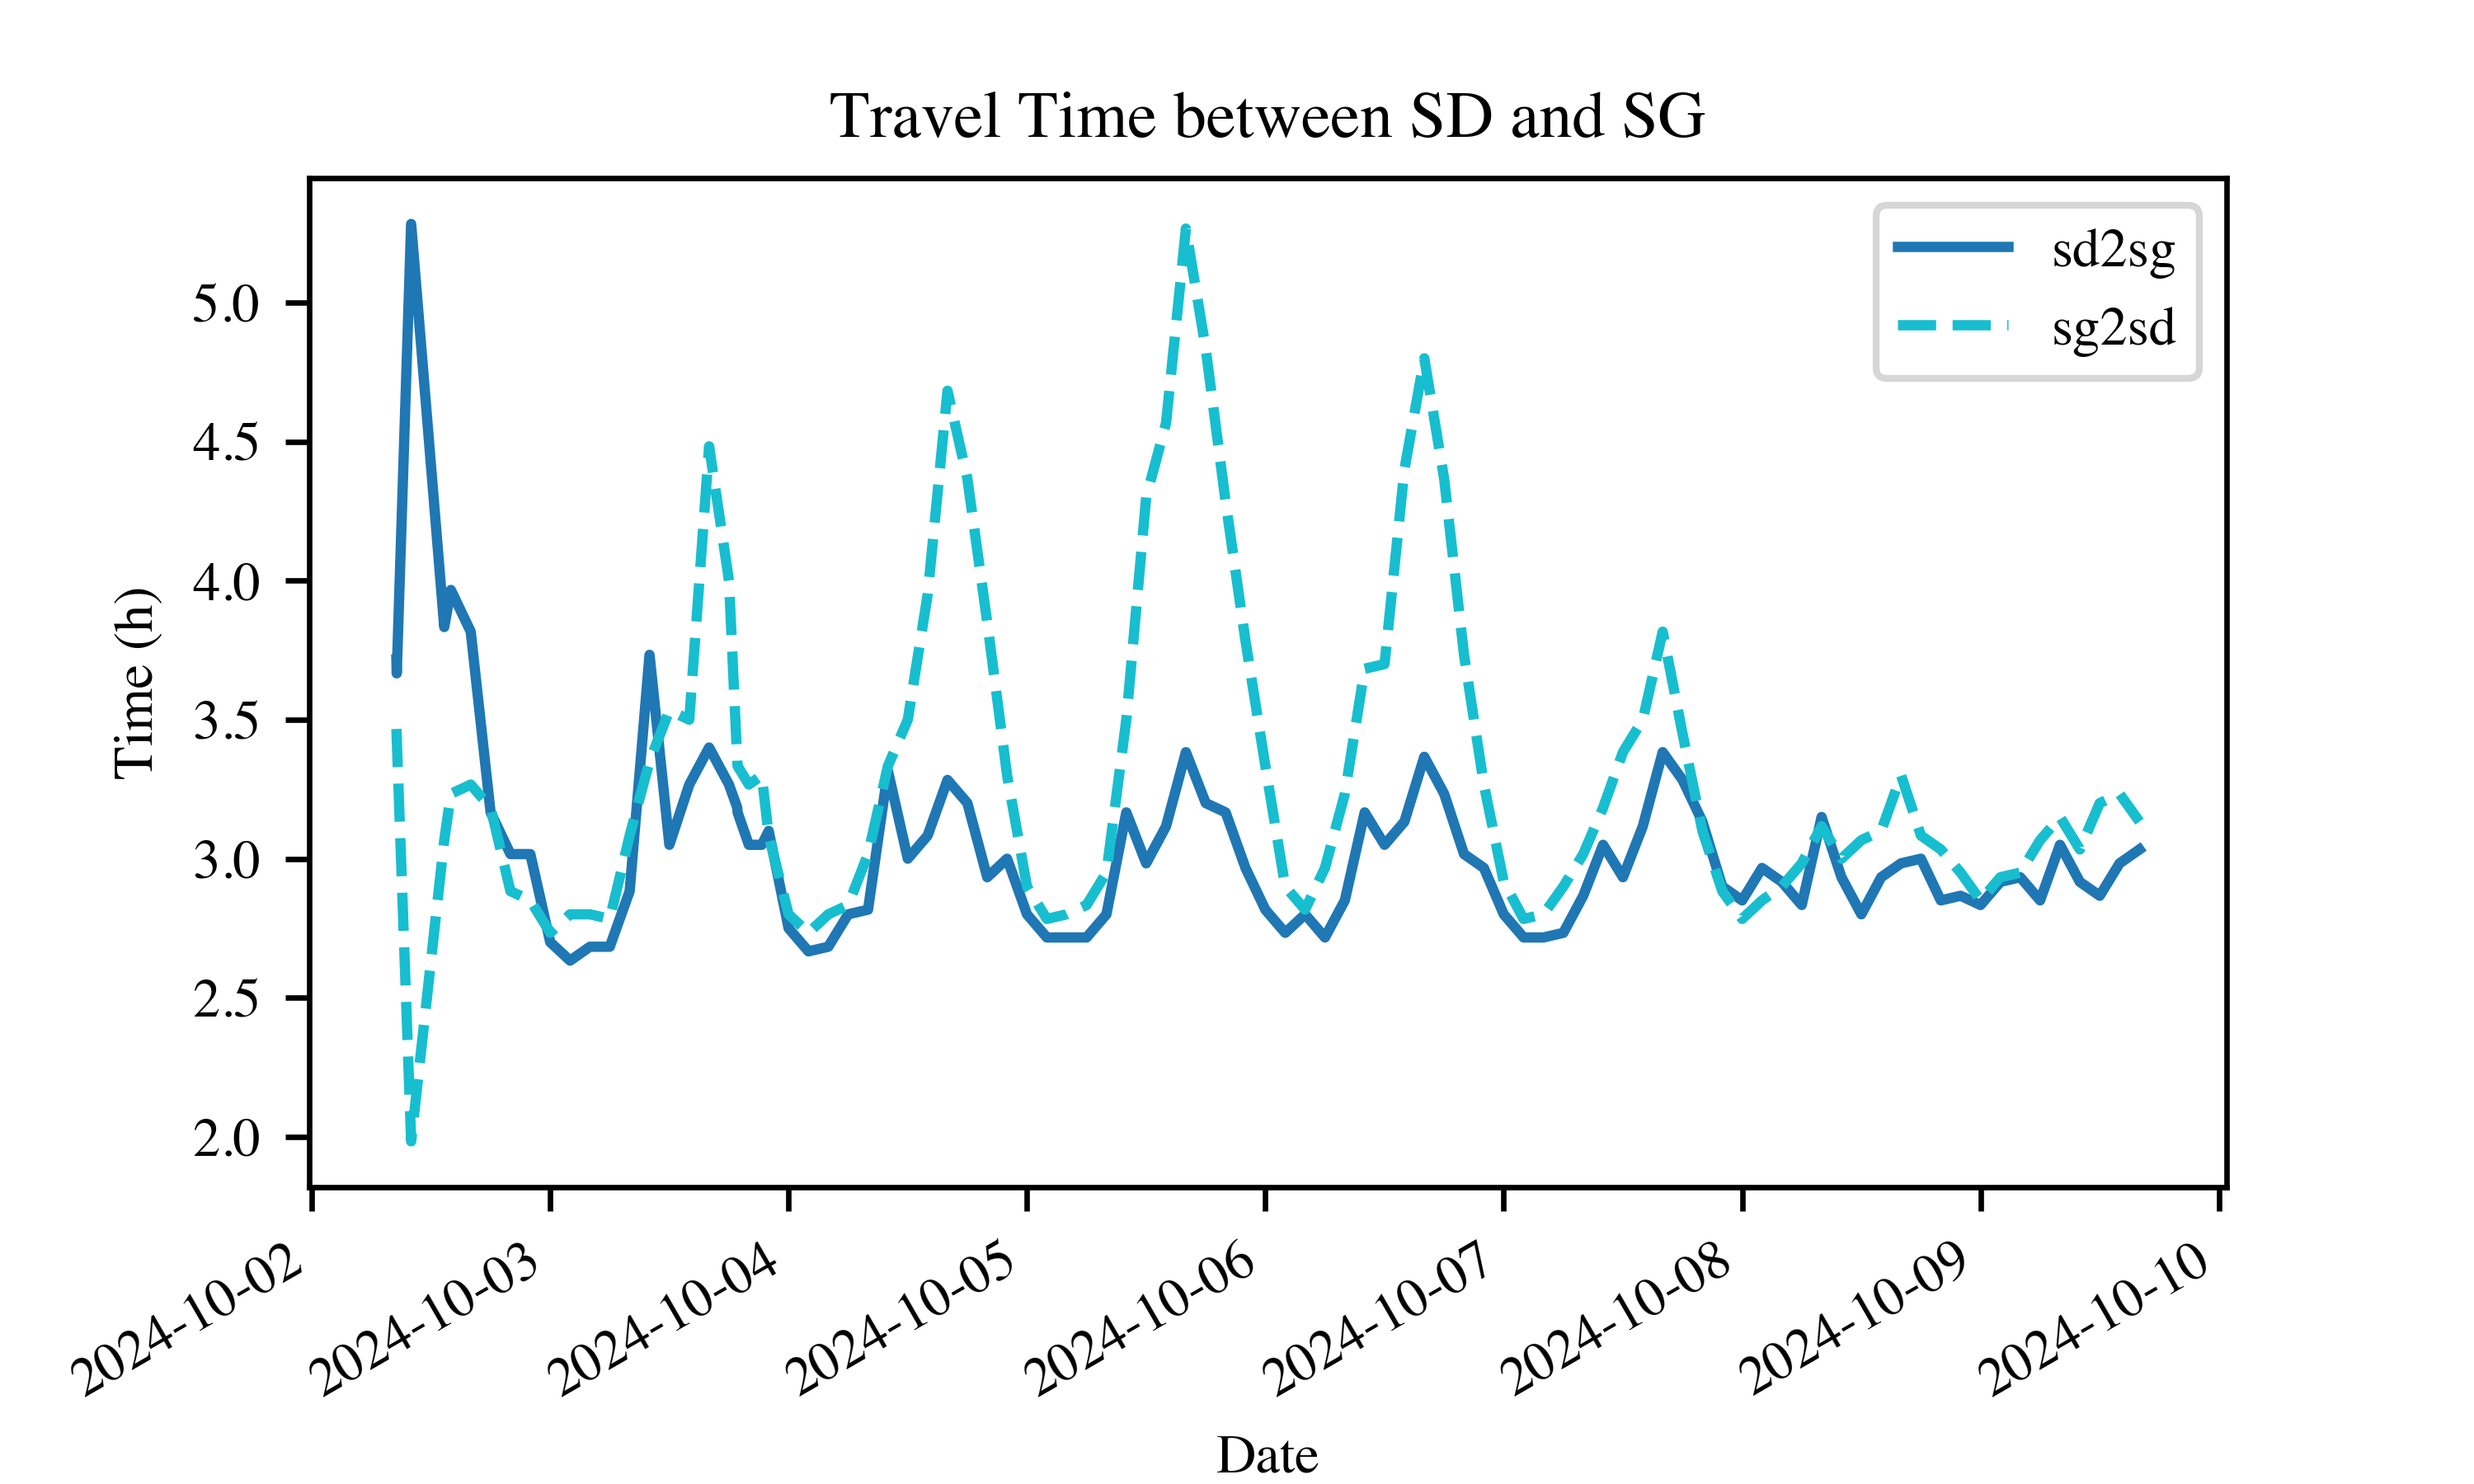
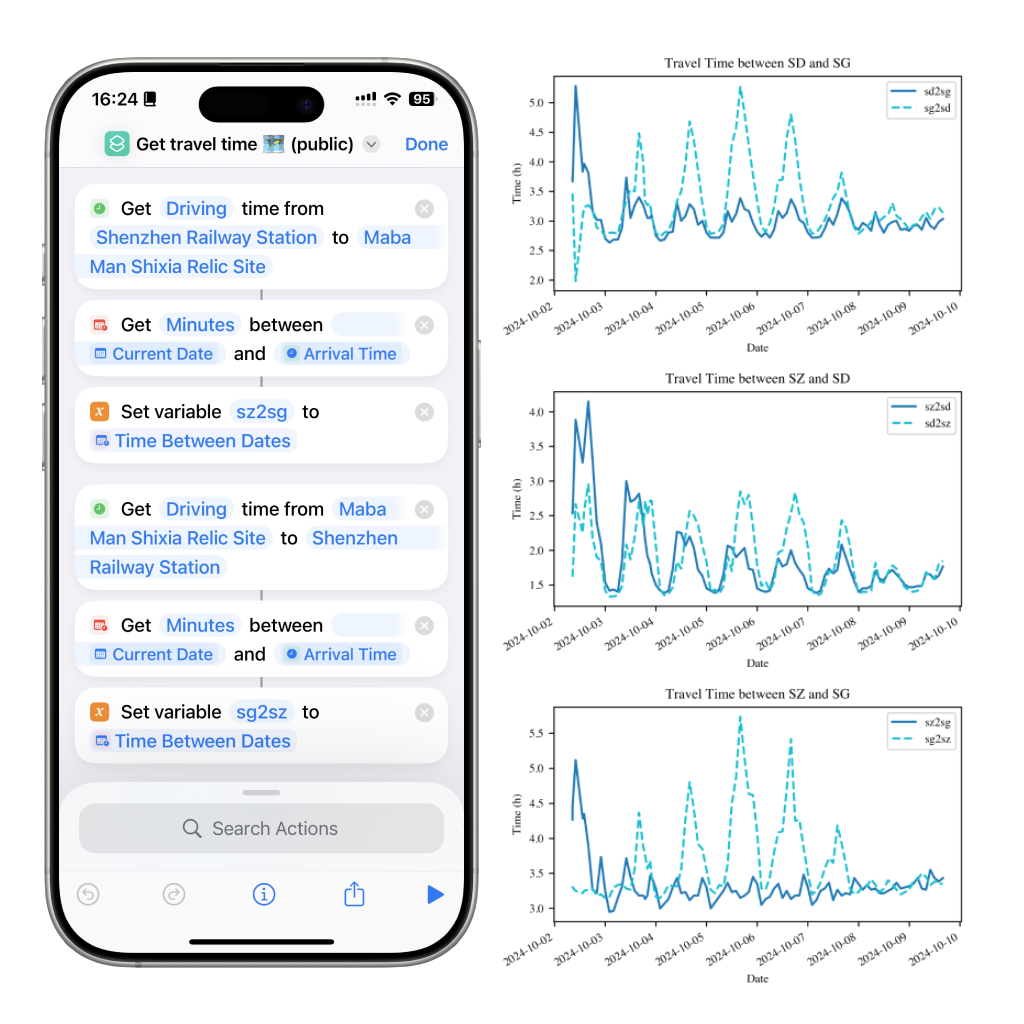
- From 1 Oct to 3 Oct, the first 2 days of the holidays, the traffic heading north (SZ -> SG, SZ -> SD, SD -> SG) was heavier than the traffic heading south. On 1 Oct, the travel time could be overwhelmingly long.
- Starting from 4 Oct, the traffic heading south surpassed the traffic heading north. The traffic pressure of the northbound traffic was gradually relieved, but the traffic pressure of the southbound traffic became heavier.
- Nevertheless, after 4 Oct, the southbound traffic pressure showed a more even-out pattern, while the northbound traffic pressure fluctuated drastically during the first 2 days of the holiday. (Recall that I took 10 hours to travel from SZ to SG on 1 Oct...)
Based on these observations:
- The traffic pressure of the northbound traffic is heavier at the beginning of the holiday, while the traffic pressure of the southbound traffic is heavier at the middle/end of the holiday.
- The northbound traffic pressure mostly focuses on the first 2 days of the holiday, while the southbound traffic pressure is more evenly distributed.
- Avoid traveling on the first 2 days of the holiday, especially for northbound traffic.
Traffic pressure during the day
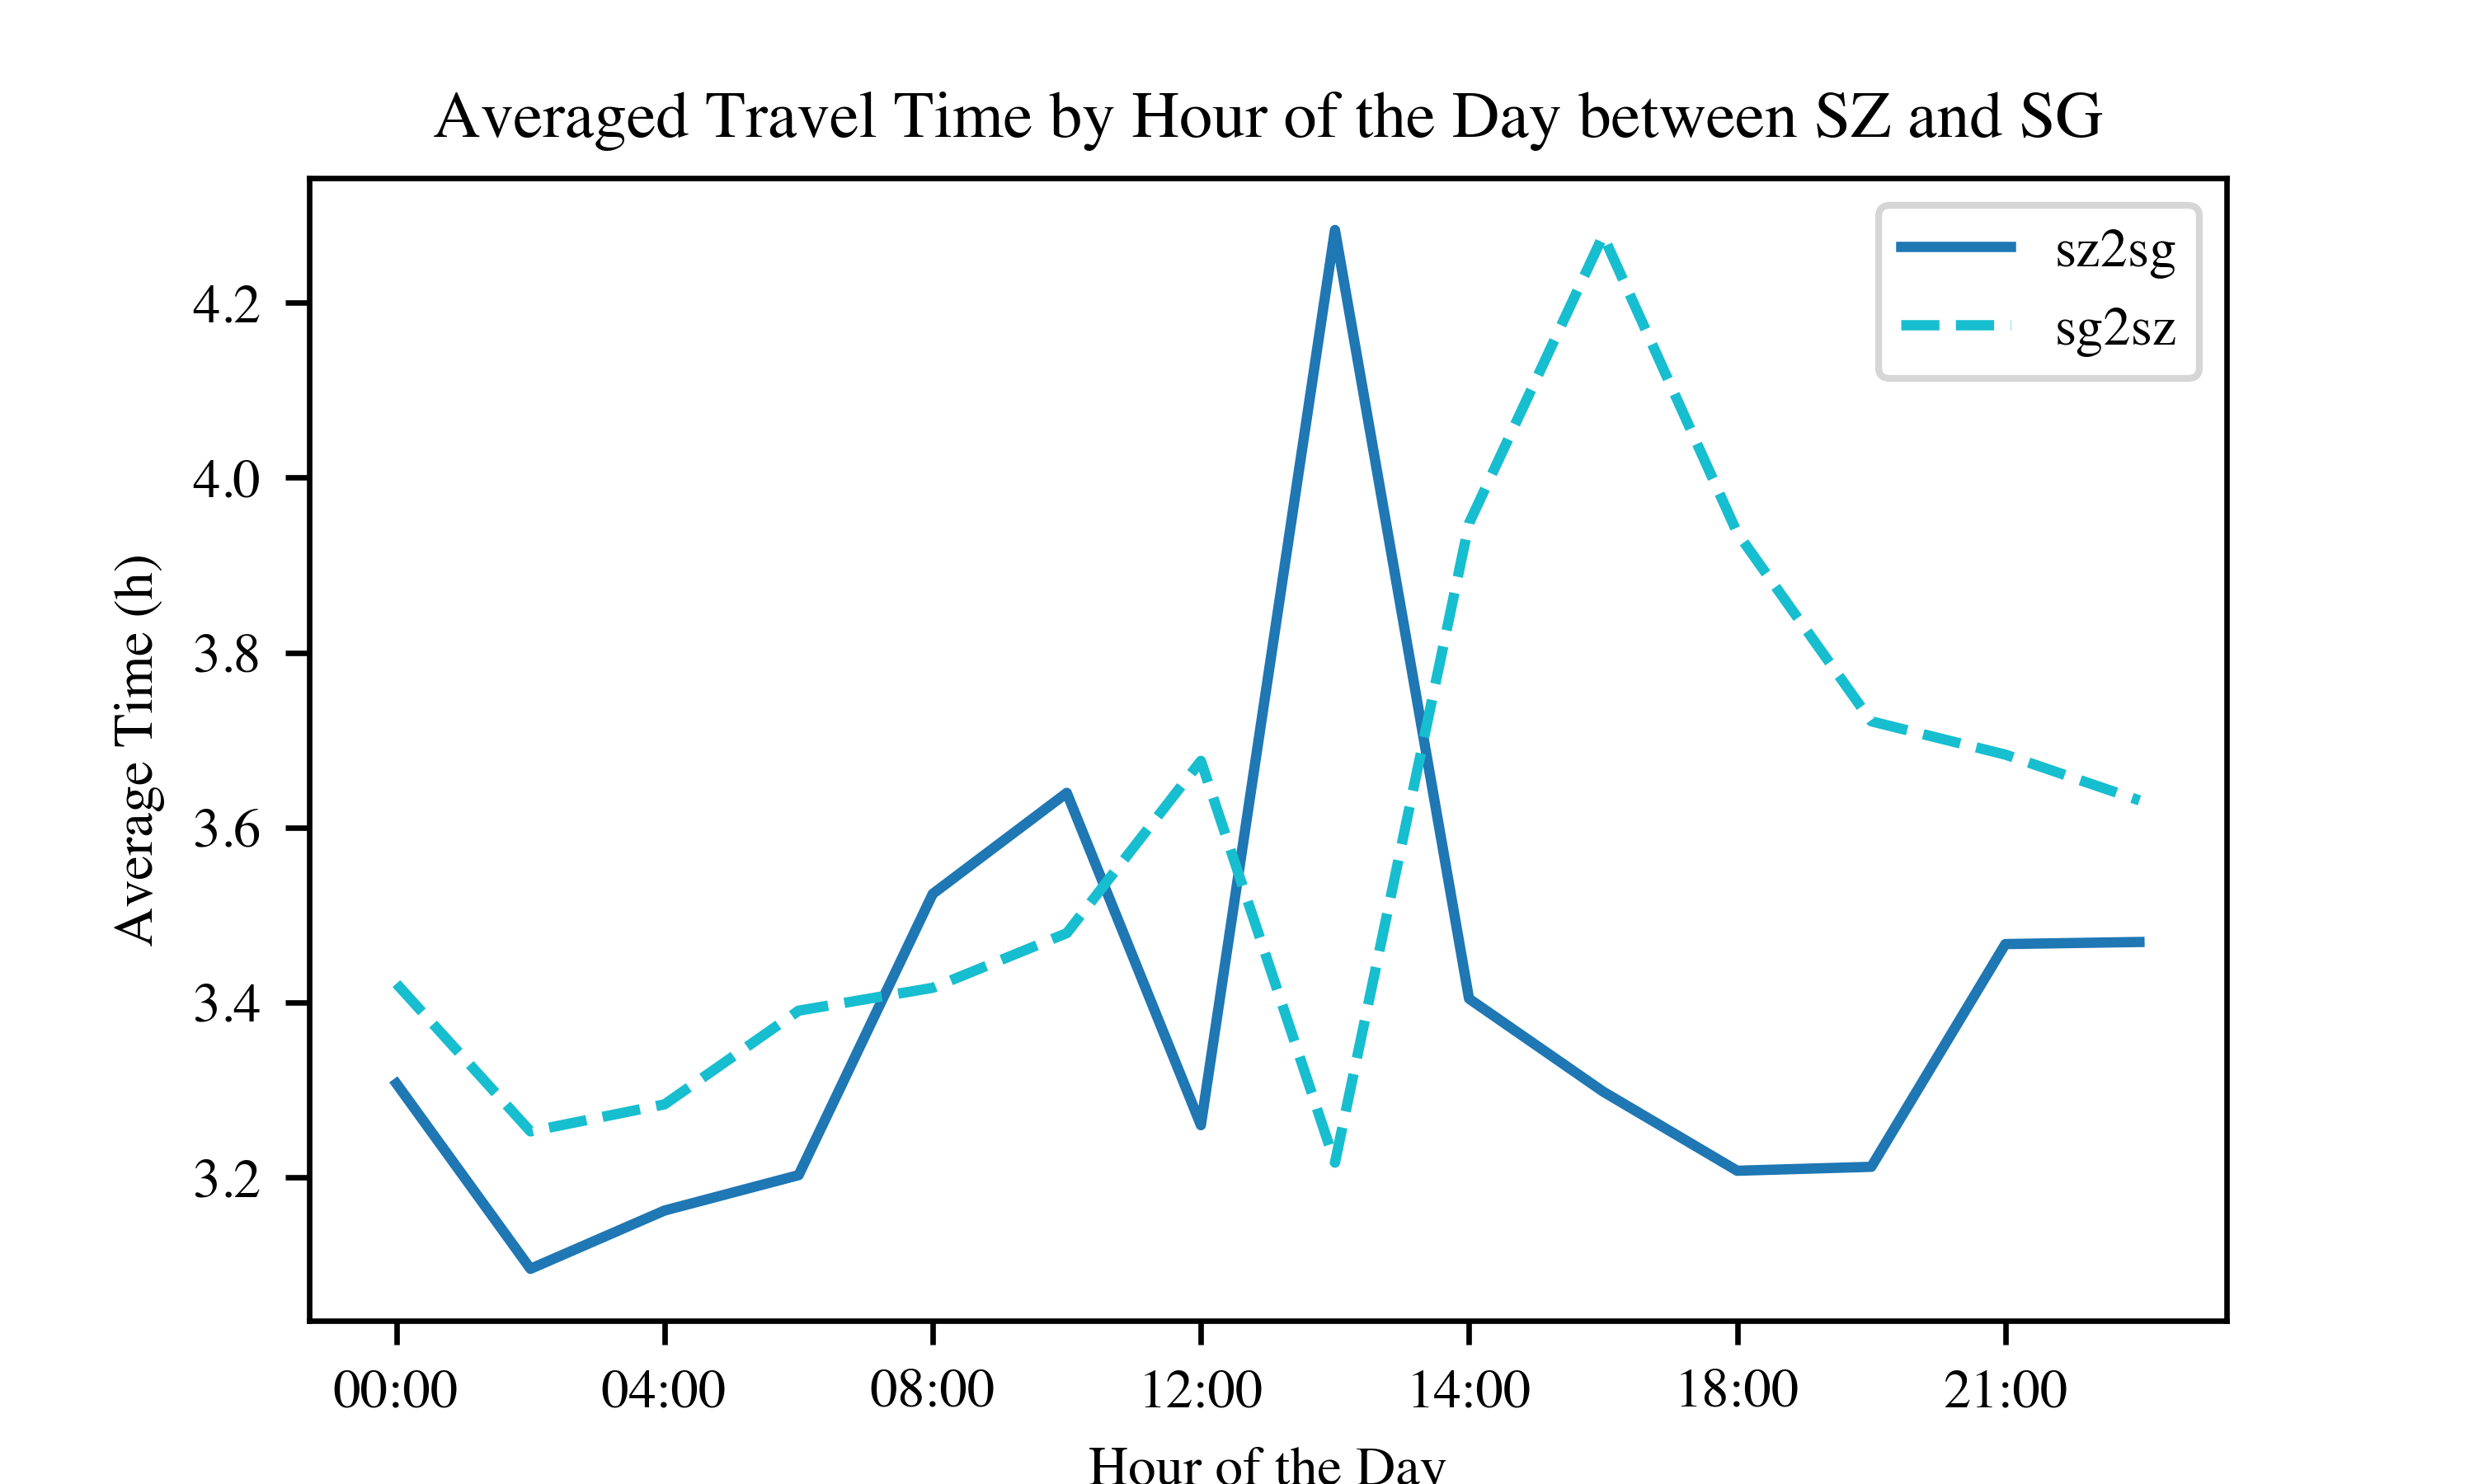
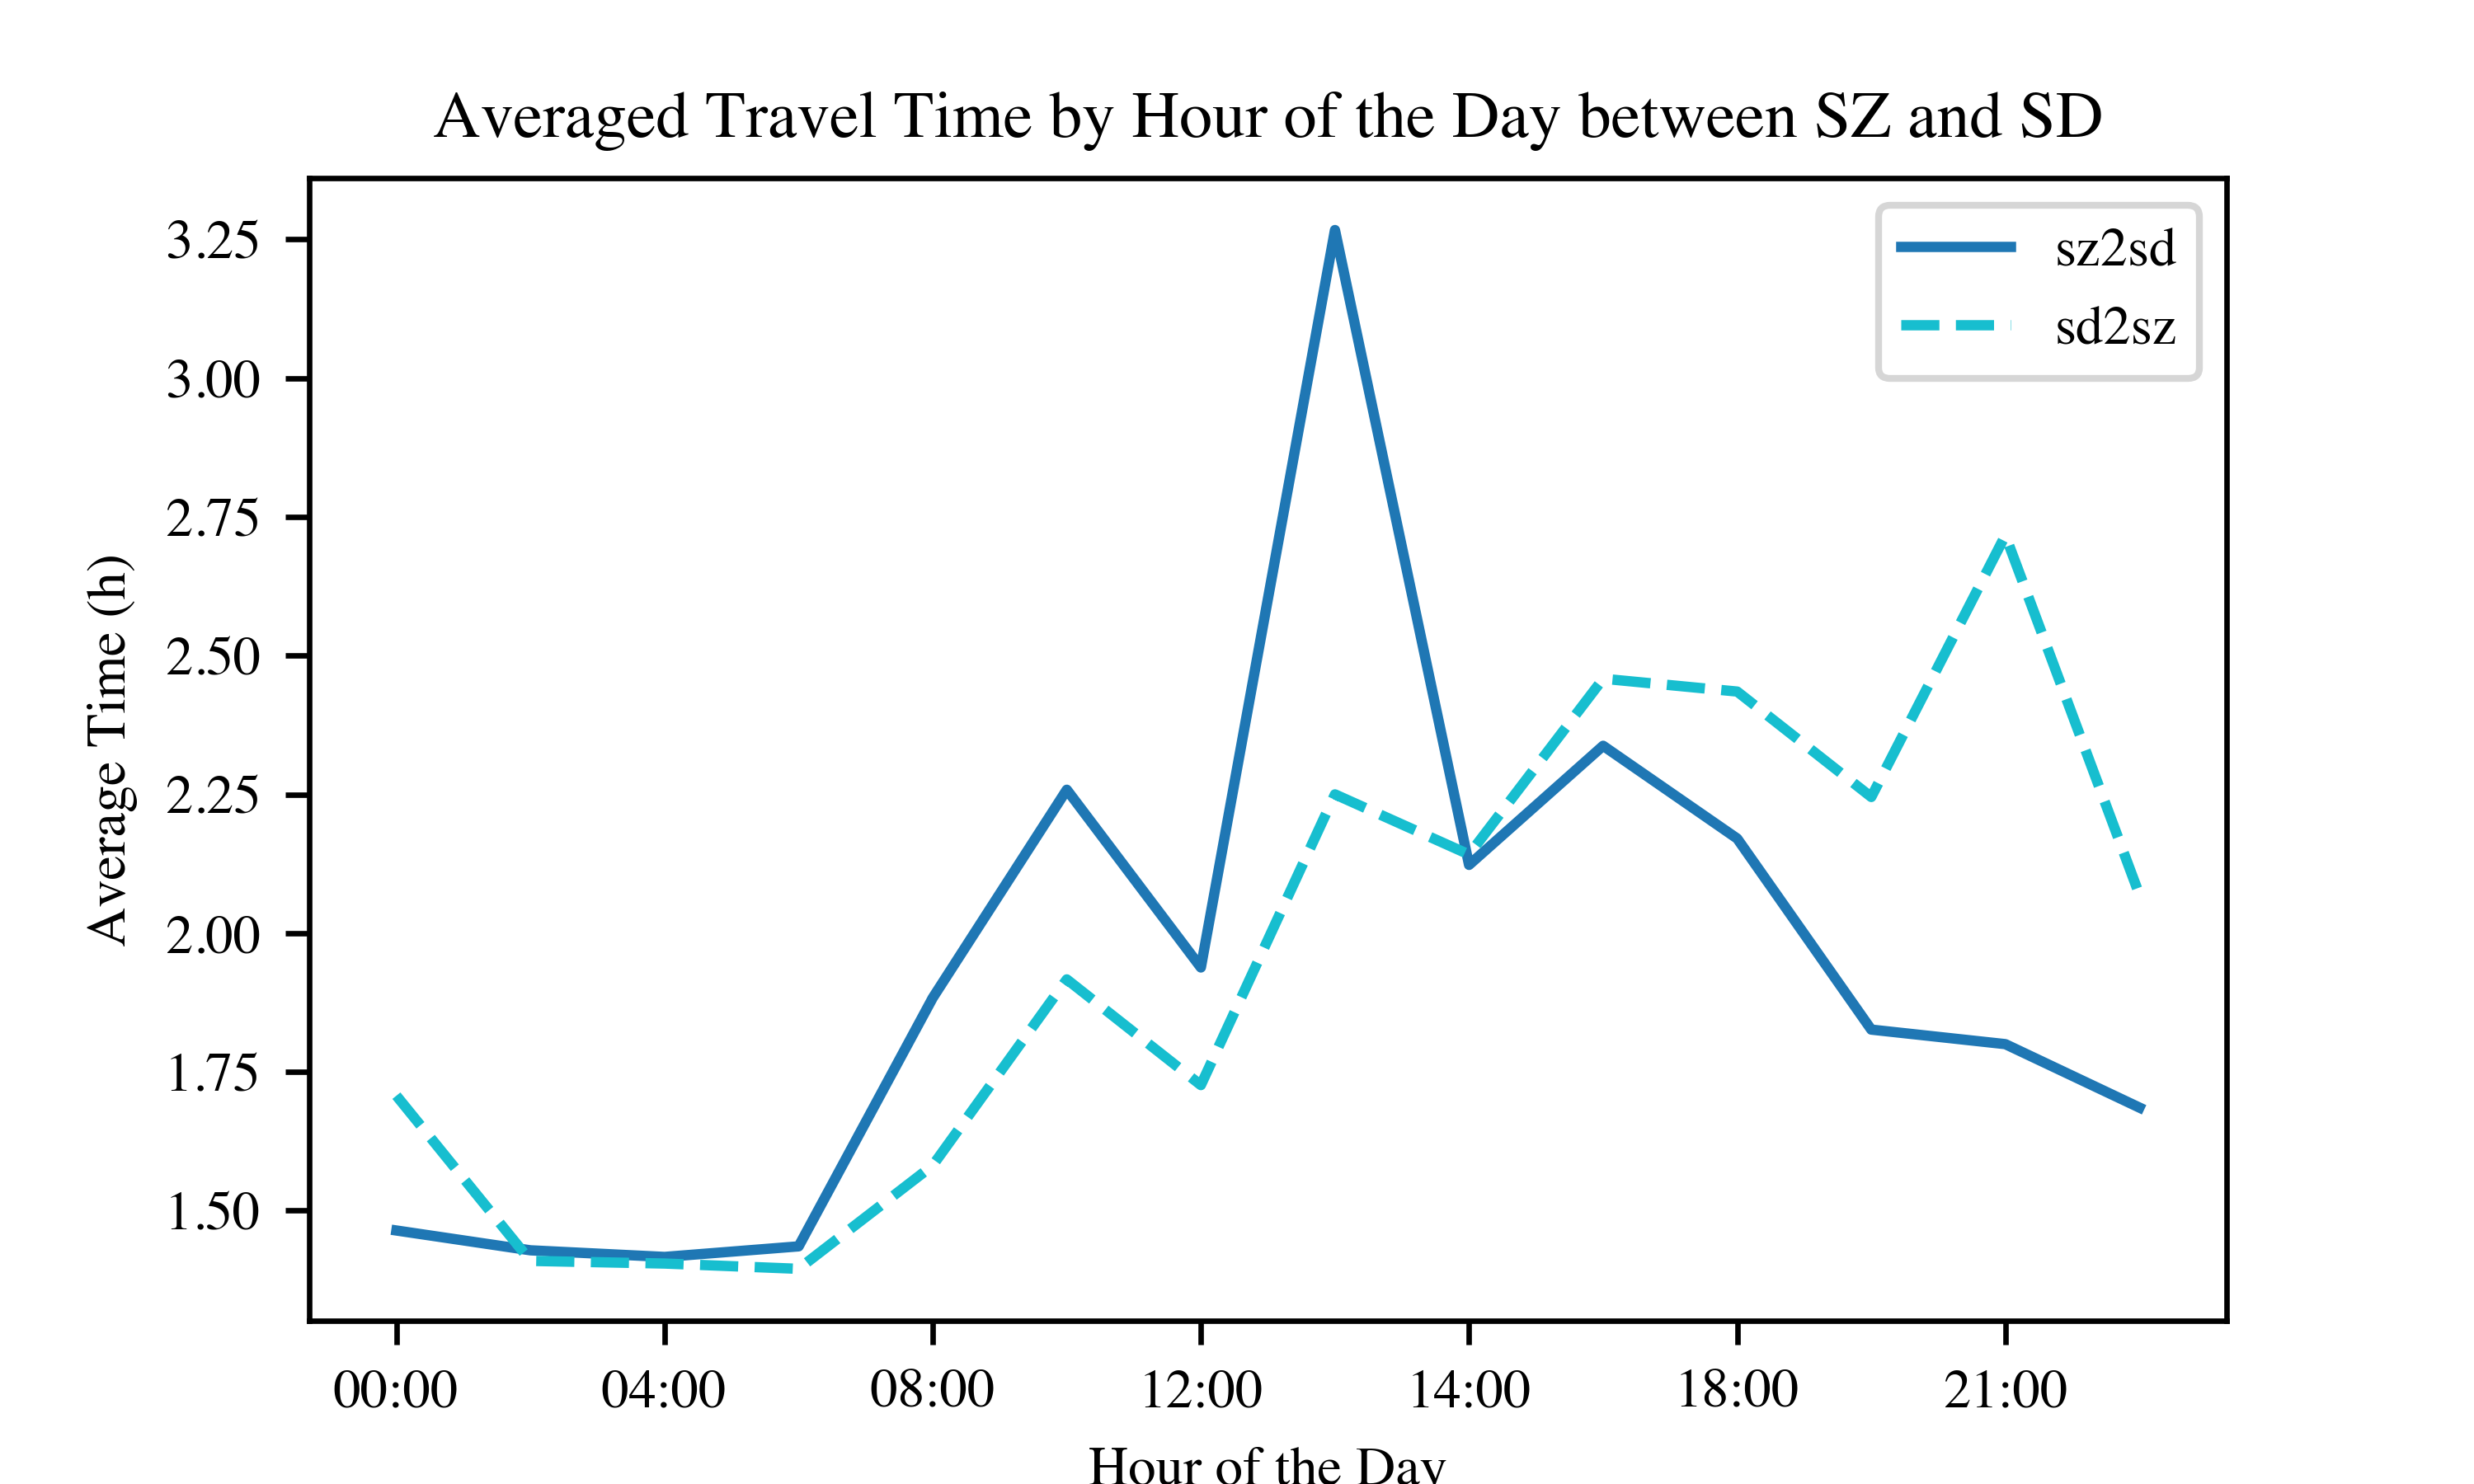
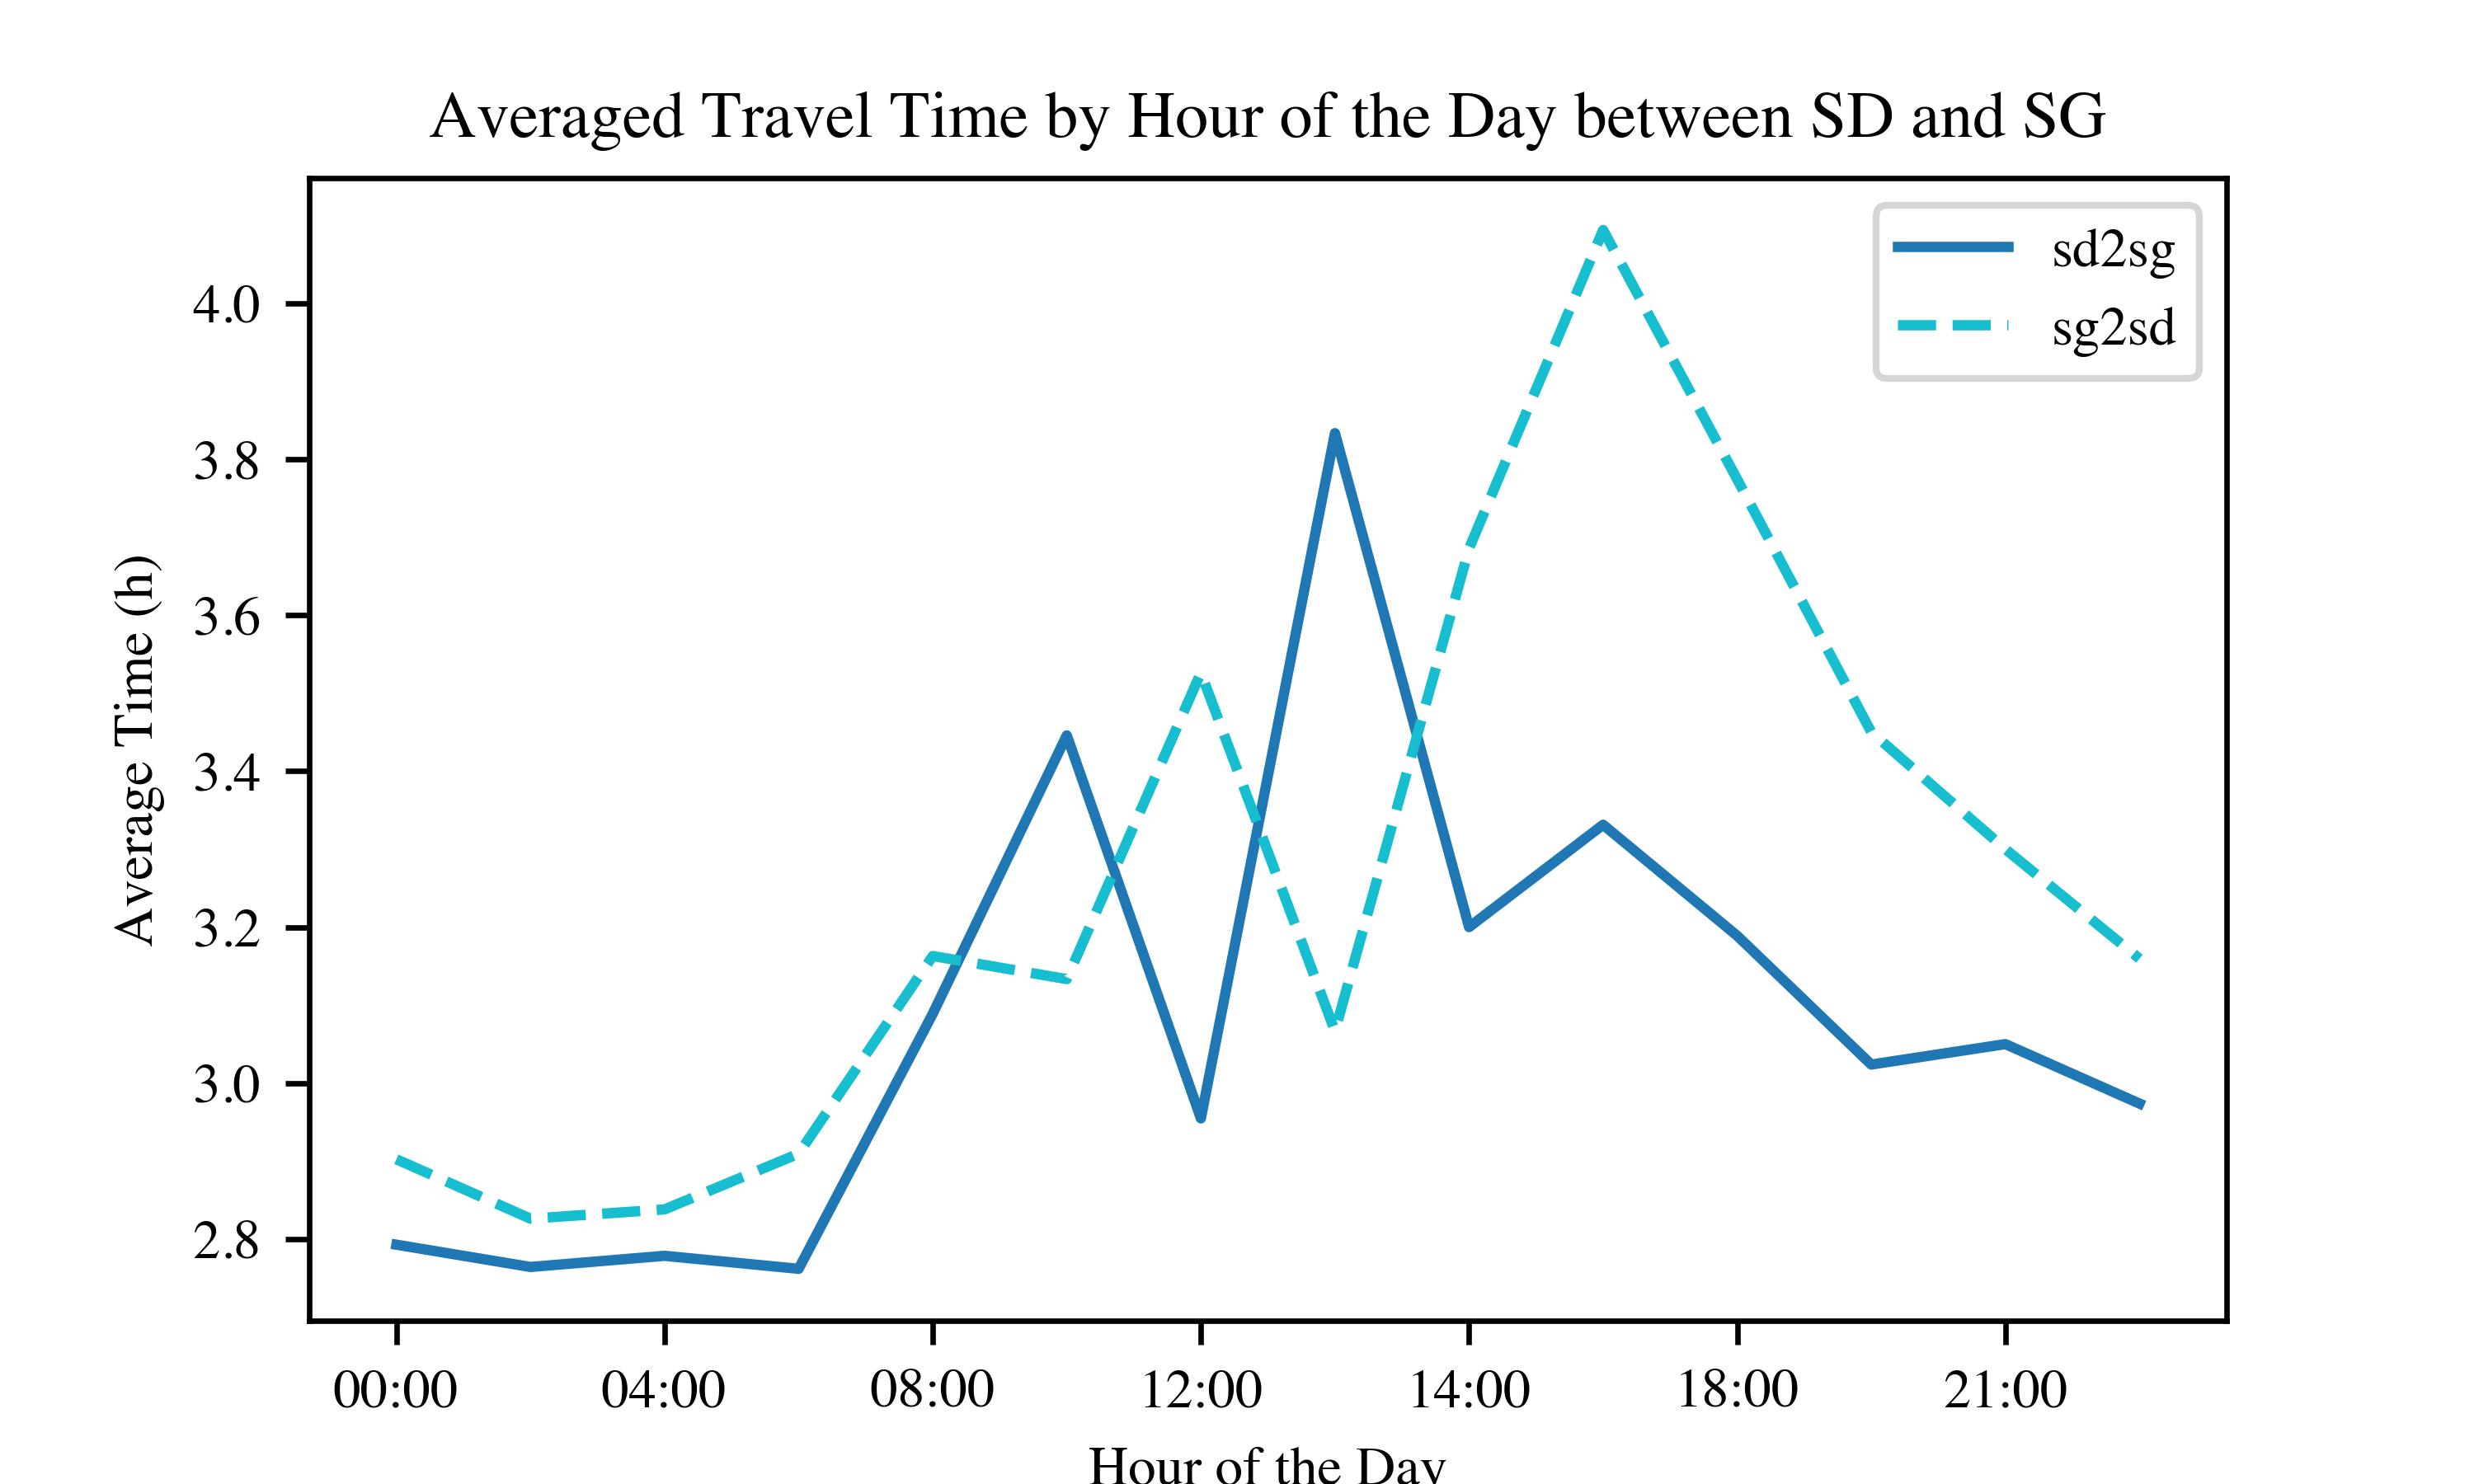
- The traffic pressure of both northbound and southbound traffic increased from 6:00.
- Northbound traffic peaked at around 13:00, while southbound traffic peaked at around 16:00 or later.
- Both northbound and southbound traffic pressure decreased at around 12:00, probably due to lunchtime.
Based on these observations:
- Southbound traffic peaks later than northbound traffic. It suggests that the north-heading travelers hope to arrive at their destination during the day, while the south-heading travelers hope to arrive at their destination at night.
- The traffic pressure of both northbound and southbound traffic decreases at around 12:00. Centering your travel time around 12:00 may help you avoid the peak traffic pressure.
- Traveling at night is the best choice if you don't mind arriving late at night.

